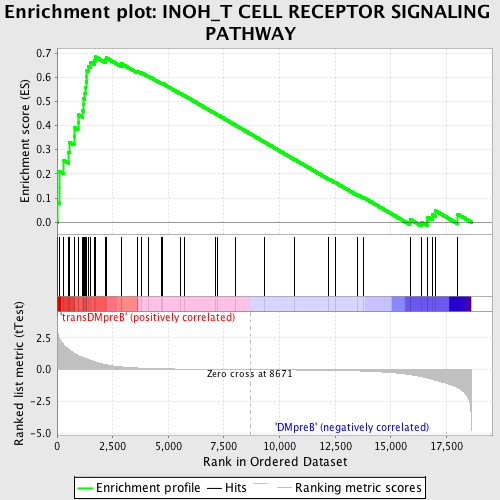
Profile of the Running ES Score & Positions of GeneSet Members on the Rank Ordered List
| Dataset | Set_04_transDMpreB_versus_DMpreB.phenotype_transDMpreB_versus_DMpreB.cls #transDMpreB_versus_DMpreB.phenotype_transDMpreB_versus_DMpreB.cls #transDMpreB_versus_DMpreB_repos |
| Phenotype | phenotype_transDMpreB_versus_DMpreB.cls#transDMpreB_versus_DMpreB_repos |
| Upregulated in class | transDMpreB |
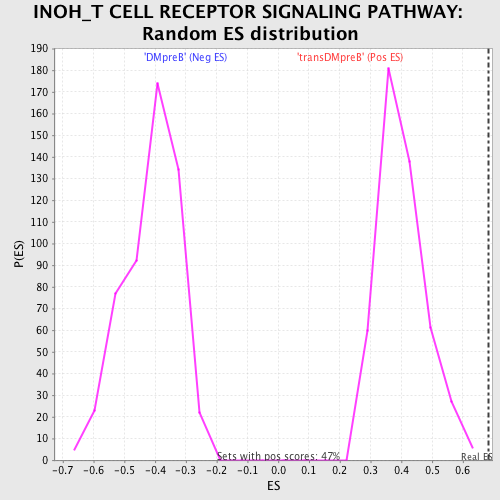
| GeneSet | INOH_T CELL RECEPTOR SIGNALING PATHWAY |
| Enrichment Score (ES) | 0.68436575 |
| Normalized Enrichment Score (NES) | 1.7065618 |
| Nominal p-value | 0.0 |
| FDR q-value | 0.09006519 |
| FWER p-Value | 0.284 |
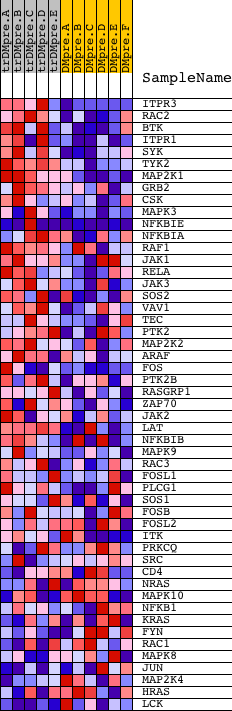
| PROBE | DESCRIPTION (from dataset) | GENE SYMBOL | GENE_TITLE | RANK IN GENE LIST | RANK METRIC SCORE | RUNNING ES | CORE ENRICHMENT | |
|---|---|---|---|---|---|---|---|---|
| 1 | ITPR3 | 9195 | 31 | 2.936 | 0.0810 | Yes | ||
| 2 | RAC2 | 22217 | 117 | 2.387 | 0.1437 | Yes | ||
| 3 | BTK | 24061 | 118 | 2.378 | 0.2107 | Yes | ||
| 4 | ITPR1 | 17341 | 285 | 1.959 | 0.2569 | Yes | ||
| 5 | SYK | 21636 | 513 | 1.619 | 0.2903 | Yes | ||
| 6 | TYK2 | 12058 19215 | 563 | 1.543 | 0.3311 | Yes | ||
| 7 | MAP2K1 | 19082 | 767 | 1.285 | 0.3563 | Yes | ||
| 8 | GRB2 | 20149 | 792 | 1.266 | 0.3907 | Yes | ||
| 9 | CSK | 8805 | 940 | 1.117 | 0.4143 | Yes | ||
| 10 | MAPK3 | 6458 11170 | 961 | 1.090 | 0.4439 | Yes | ||
| 11 | NFKBIE | 23225 1556 | 1147 | 0.973 | 0.4613 | Yes | ||
| 12 | NFKBIA | 21065 | 1178 | 0.947 | 0.4864 | Yes | ||
| 13 | RAF1 | 17035 | 1186 | 0.942 | 0.5126 | Yes | ||
| 14 | JAK1 | 15827 | 1249 | 0.894 | 0.5344 | Yes | ||
| 15 | RELA | 23783 | 1277 | 0.876 | 0.5576 | Yes | ||
| 16 | JAK3 | 9198 4936 | 1299 | 0.858 | 0.5807 | Yes | ||
| 17 | SOS2 | 21049 | 1331 | 0.845 | 0.6028 | Yes | ||
| 18 | VAV1 | 23173 | 1340 | 0.841 | 0.6260 | Yes | ||
| 19 | TEC | 16514 | 1394 | 0.805 | 0.6458 | Yes | ||
| 20 | PTK2 | 22271 | 1498 | 0.741 | 0.6612 | Yes | ||
| 21 | MAP2K2 | 19933 | 1669 | 0.648 | 0.6703 | Yes | ||
| 22 | ARAF | 24367 | 1729 | 0.613 | 0.6844 | Yes | ||
| 23 | FOS | 21202 | 2168 | 0.392 | 0.6718 | No | ||
| 24 | PTK2B | 21776 | 2197 | 0.385 | 0.6812 | No | ||
| 25 | RASGRP1 | 5360 14476 9694 | 2883 | 0.220 | 0.6505 | No | ||
| 26 | ZAP70 | 14271 4042 | 2886 | 0.219 | 0.6565 | No | ||
| 27 | JAK2 | 23893 9197 3706 | 3607 | 0.130 | 0.6214 | No | ||
| 28 | LAT | 17643 | 3622 | 0.129 | 0.6243 | No | ||
| 29 | NFKBIB | 17906 | 3771 | 0.117 | 0.6196 | No | ||
| 30 | MAPK9 | 1233 20903 1383 | 4094 | 0.096 | 0.6050 | No | ||
| 31 | RAC3 | 20561 | 4683 | 0.069 | 0.5752 | No | ||
| 32 | FOSL1 | 23779 | 4717 | 0.068 | 0.5754 | No | ||
| 33 | PLCG1 | 14753 | 5539 | 0.045 | 0.5324 | No | ||
| 34 | SOS1 | 5476 | 5727 | 0.041 | 0.5235 | No | ||
| 35 | FOSB | 17945 | 7115 | 0.019 | 0.4493 | No | ||
| 36 | FOSL2 | 4733 8978 16878 | 7223 | 0.017 | 0.4440 | No | ||
| 37 | ITK | 4934 | 8021 | 0.007 | 0.4013 | No | ||
| 38 | PRKCQ | 2873 2831 | 9311 | -0.008 | 0.3321 | No | ||
| 39 | SRC | 5507 | 10688 | -0.026 | 0.2588 | No | ||
| 40 | CD4 | 16999 | 12204 | -0.054 | 0.1787 | No | ||
| 41 | NRAS | 5191 | 12495 | -0.061 | 0.1648 | No | ||
| 42 | MAPK10 | 11169 | 13511 | -0.099 | 0.1129 | No | ||
| 43 | NFKB1 | 15160 | 13771 | -0.113 | 0.1021 | No | ||
| 44 | KRAS | 9247 | 15861 | -0.392 | 0.0007 | No | ||
| 45 | FYN | 3375 3395 20052 | 15886 | -0.398 | 0.0106 | No | ||
| 46 | RAC1 | 16302 | 16377 | -0.547 | -0.0004 | No | ||
| 47 | MAPK8 | 6459 | 16644 | -0.646 | 0.0035 | No | ||
| 48 | JUN | 15832 | 16667 | -0.656 | 0.0208 | No | ||
| 49 | MAP2K4 | 20405 | 16860 | -0.753 | 0.0317 | No | ||
| 50 | HRAS | 4868 | 17006 | -0.832 | 0.0473 | No | ||
| 51 | LCK | 15746 | 17991 | -1.398 | 0.0337 | No |